
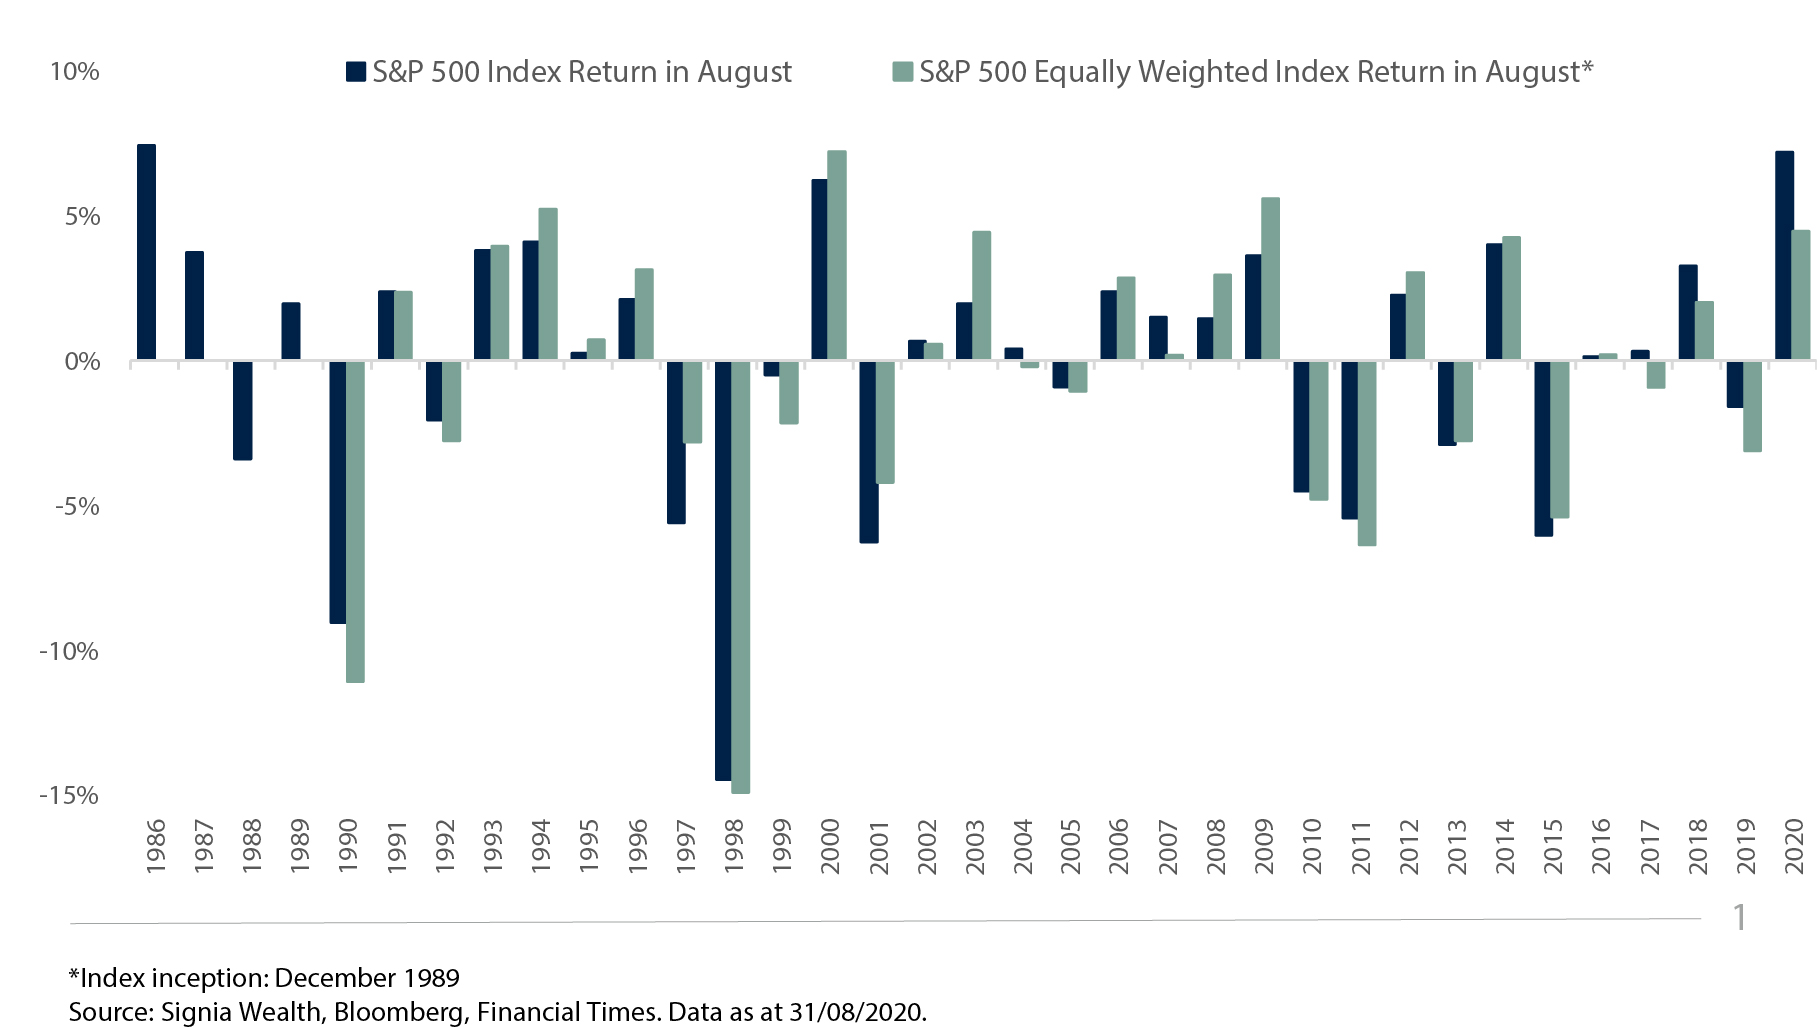
The best August for the S&P 500 since 1986, but why?
The word ‘unprecedented’ gets bandied around a lot these days. Despite the remarkable and once unthinkable events of Brexit and the election of Donald Trump in recent years, the 2020 Coronavirus Crisis has arguably been the most impactful and shocking of unprecedented events in recent history, as it has in turn set off a chain of unprecedented events this year.
The pandemic prompted the fastest bear market in financial history during the March Meltdown, by inducing the sharpest economic recessions on record across most major economies around the world. Then followed unprecedented amounts of monetary and fiscal stimulus from global policymakers, the corollary of which has been an unprecedented bounce back in financial markets with the S&P 500 equity index rallying powerfully from its 23 March low to rise 1,270 points or 57% to a new all-time high of 3,508 in August. Indeed, it was the best August for the S&P 500 since 1986, returning+7.2% during the month at a staggering annualised pace of 126%! But four months after the March nadir why are we seeing this now?
The answer lies partly within the make up of the S&P 500 index, in particular the growing outperformance of the mega cap growth stocks and their concentration within the index. The largest five companies by market capitalisation – known as the FAAMG group (Facebook, Amazon, Apple, Microsoft and Google) – now make up a quarter of the index, with the other 495 companies representing the remaining 75%.
This concentration has been growing over recent years and has contributed to the S&P 500 index outperforming the equally-weighted index in each of the last four Augusts since 2017. Furthermore, it has accelerated this year during the US mega cap summer rally that has supercharged the S&P 500 index, causing it to outperform its equally-weighted counterpart by 2.7% in August and by an amazing 12.0% on a year-to-date basis.
To put this into context, Apple, the world’s largest company by market value, added $650bn to its market-cap in August, roughly the value of the whole US energy sector, yet this happened in a month when the European Union intensified an anti-trust investigation into Apple.
Behind the scenes however, it’s reported that a significant increase in options positioning by SoftBank into US equities and technology companies in particular, has fuelled the rally, forcing option dealers to chase the underlying stocks (in a bid to cover their own exposure) and, in doing so, helped create the upside vacuum we have witnessed. Clearly, this is bubble behaviour and bubbles don’t last forever, but with the FAAMGs currently matching their huge market values with huge cash profits, perhaps this bubble has further to go.
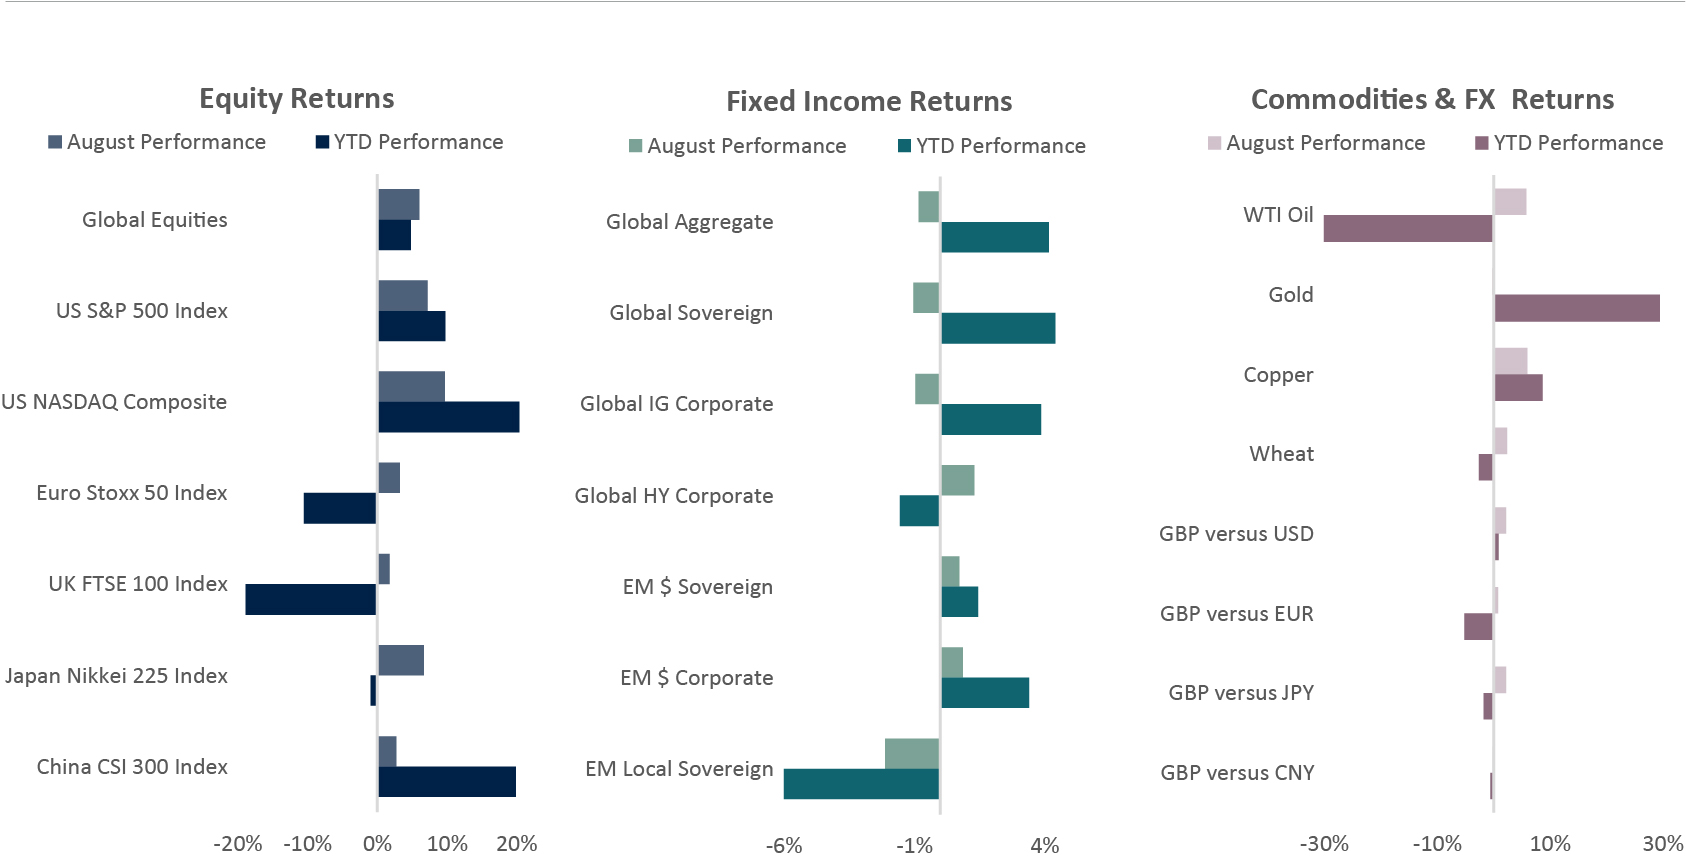
Source: Signia Wealth, Bloomberg. Data as at 31/08/2020. Global Equities: iShares MSCI ACWI ETF; Global Aggregate: Vanguard Global Bond Index GBP Hedged Fund; Global Sovereign: Xtrackers Global Government Bond GBP Hedged ETF; Global IG Corporate: Vanguard Global Corporate Bond Index GBP Hedged Fund; Global HY Corporate: iShares Global High Yield Corporate Bond GBP Hedged ETF; EM$ Sovereign: iShares J.P. Morgan USD EM Bond ETF; EM$ Corporate: iShares J.P. Morgan USD EM Corporate Bond ETF; EM Local Sovereign: iShares J.P. Morgan EM Local Government Bond ETF.
Equities
• US equities achieved the highest returns during August, with demand for mega-cap technology companies driving the Nasdaq and S&P 500 indices higher
• Japanese equities also posted robust returns for the month, however European and UK bourses underperformed
• Domestic Chinese equities delivered modest gains, with further consolidation being seen after strong performance for the year to date

Jack Rawcliffe
Fixed Income
• August saw a continuation in the recovery since the lows reached back in March. In this risk-on environment investors shied away from safe haven assets, with the Bloomberg Barclays global sovereign index down -0.95%.
• Global credit indices were mixed as continued support from central banks providing adequate liquidity meant the Bloomberg Barclays global high yield index ended the month up +1.39% whilst the Bloomberg Barclays global investment grade index was down -0.76%.
• Finally, it was a mixed month for emerging market debt with both hard currency corporate and sovereign Bloomberg Barclays indices up +0.97% and +0.35% respectively, whilst the Bloomberg Barclays EM local currency sovereign debt index was down -2.24% as Sterling appreciated against EM currencies.

Grégoire Sharma
Commodities & FX
• In August, Gold had its first negative month since March, dropping nearly half a percent as economic data improved and investors took profits. The precious metal continues to be up by nearly 30% for 2020.
• The Dollar continued its decline in August as investors pivoted out of the currency in favour of the likes of the Euro after regained confidence in both the regions fiscal and monetary unity. The Dollar dropped over 1.3% against the Euro, and over 2% against Sterling.

Harry Elliman
Choose a Service to Invest through
World
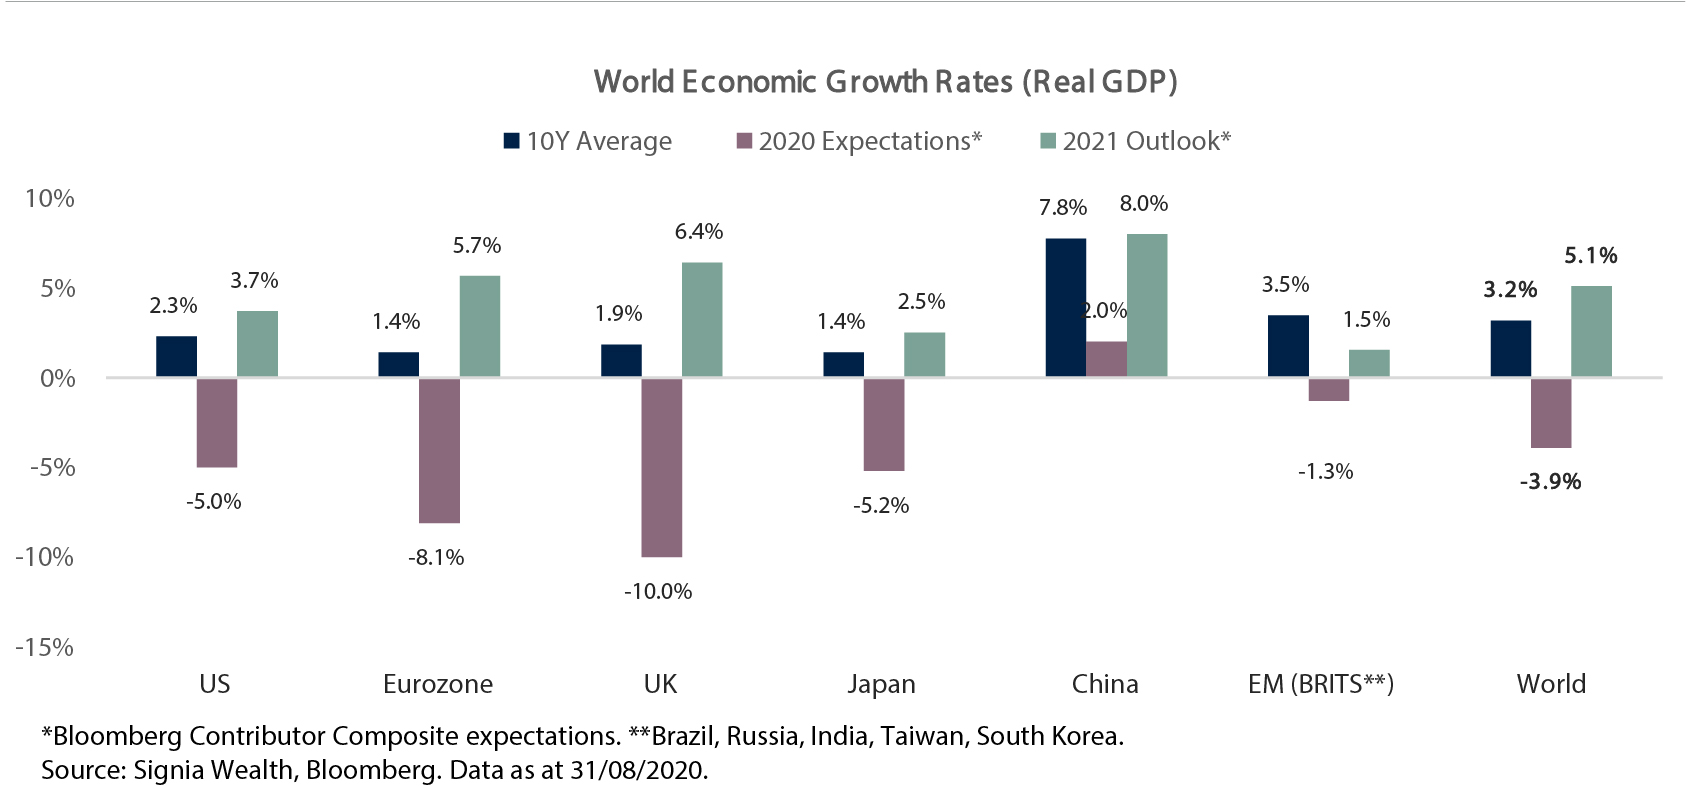
Expectations for world economic growth in 2020 continue to be revised down in the wake of the Coronavirus crisis, from+3.1% at the end of 2019 to -3.9% in August. Asian economies are expected to outperform with China and Taiwan the only major economies expected to grow this year. Currently, world growth is expected to rebound strongly in 2021, although this remains largely contingent on vaccine developments and the severity of a Covid-19 winter wave.
United States of America
The US economy is rebounding quicker than expected after the shortest sharpest recession in history, which saw the economy contract -10.4% in nominal terms during the first half of 2020. However, coronavirus infections remain high, employment gains are losing momentum, and congress remains divided on further fiscal stimulus to aid the economy.
Eurozone
Europe entered 2020 on a relatively weaker economic footing with a weaker structural growth rate and so it’s no surprise that it has experienced a deeper recession this year versus other regional economies. Deflation risk is a real concern but with the European Recovery Plan now agreed amongst member states, expectations for higher economic growth in 2021 and beyond are rising.
United Kingdom
The UK has followed a similar economic fate to the Eurozone but after being slower to introduce coronavirus containment measures the UK has suffered a worse economic hit with the highest Covid-19 deaths for any country in Europe. A strong fiscal response from Chancellor Rishi Sunak has improved the economic outlook for 2021.
Japan
Prime Minister Shinzo Abe has resigned due to health reasons and the ruling Liberal Democratic party is expected to select a new leader and PM within weeks. Abe leaves a struggling Japanese economy that has been supported by some of the most significant monetary and fiscal stimulus packages announced by any country relative to its size.
China
China is one of very few global economies that has avoided a recession this year by growing an impressive 11.5% in the second quarter after quickly returning economic operating capacity back towards 2019 levels. Chinese GDP is expected to continue its solid growth path and rebound to around its long-term historical growth rate of 8% in 2021.
Emerging Markets
Emerging economies outside of Asia have been amongst the last to feel the full economic and humanitarian impact from the coronavirus crisis. Performance is expected to be mixed this year with commodity producers Brazil and Russia suffering from a collapse in prices, India as a net importer of commodities benefitting from price declines; and Taiwan and South Korea feeling less economic pain domestically due to successful virus testing and containment measures.
Important Information
The information set out in this document has been provided for information purposes only and should not be construed as any type of solicitation, offer, or recommendation to acquire or dispose of any investment, engage in any transaction or make use of the services of Signia. Information about prior performance, while a useful tool in evaluating Signia’s investment activities is not indicative of future results and there can be no assurance that Signia will generate results comparable to those previously achieved. Any targeted returns set out in this document are provided as an indicator as to how your investments will be managed by Signia and are not intended to be viewed as a representation of likely performance returns. There can be no assurance that targeted returns will be realised. An estimate of the potential return from an investment is not a guarantee as to the quality of the investment or a representation as to the adequacy of the methodology for estimating returns. The information and opinions enclosed are subject to change without notice and should not be construed as research. No responsibility is accepted to any person for the consequences of any person placing reliance on the content of this document for any purpose. No action has been taken to permit the distribution of this document in any jurisdiction where any such action is required. Such distribution may be restricted in certain jurisdictions and, accordingly, this document does not constitute, and may not be used for the purposes of, an offer or solicitation to any person in any jurisdiction were such offer or solicitation is unlawful. Signia Wealth is authorised and regulated by the Financial Conduct Authority.