
A goldilocks environment for gold
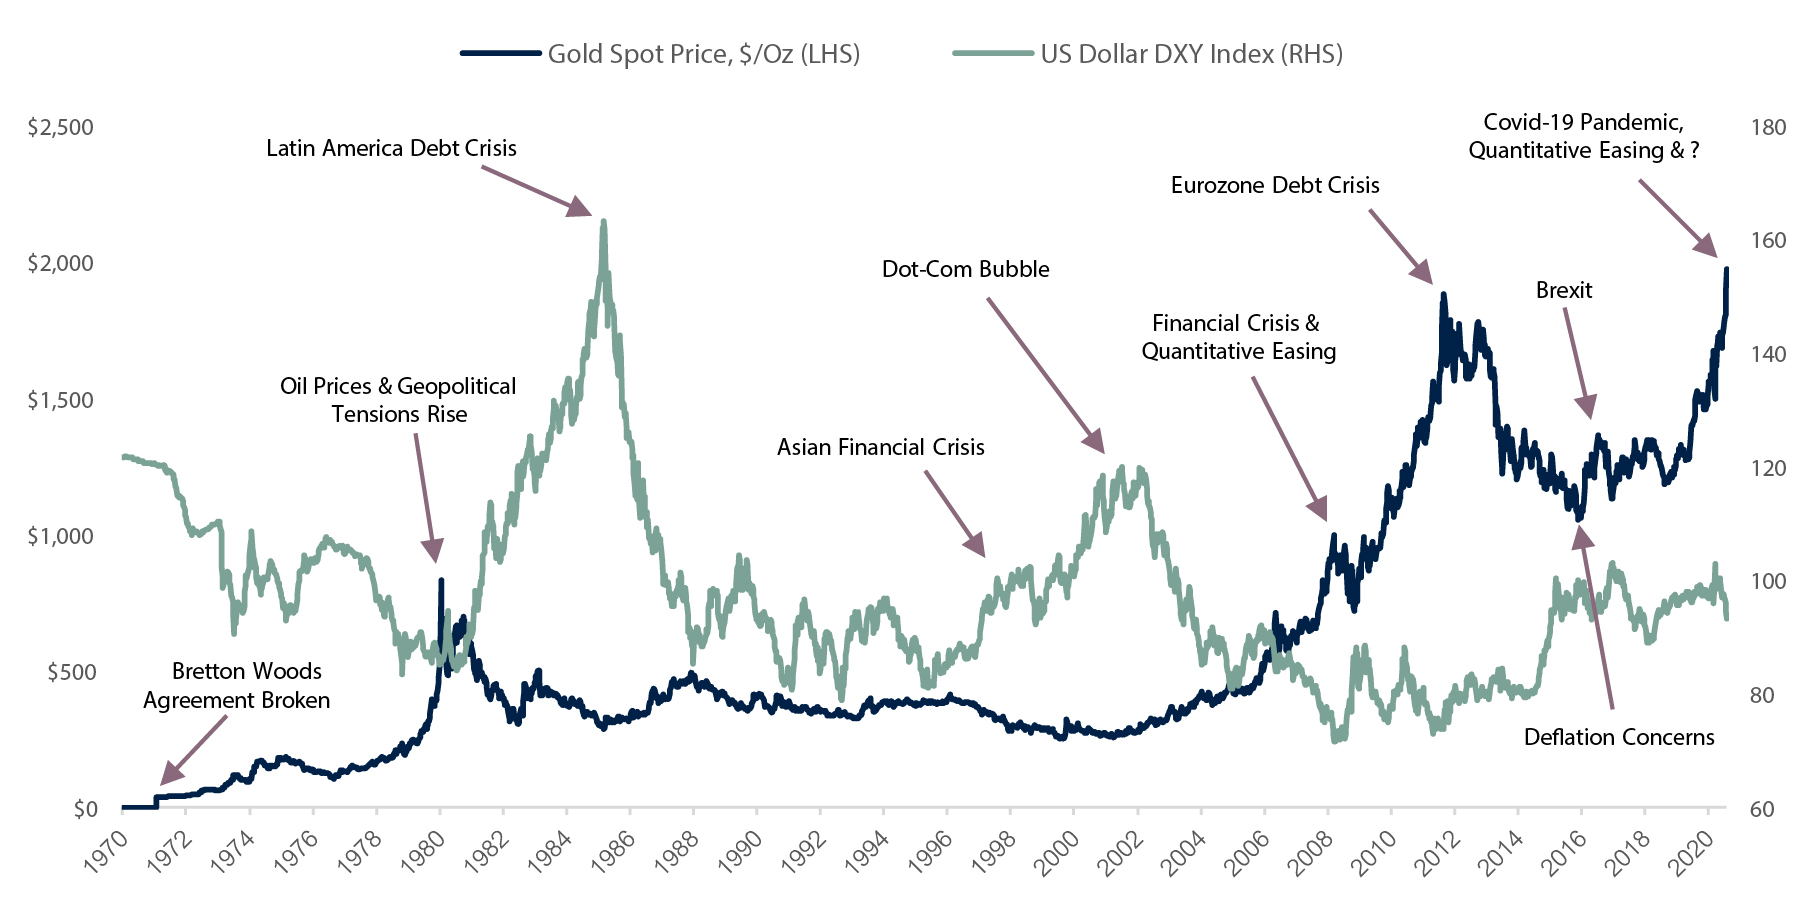
On 15 August 1971, Richard Nixon announced that the United States would no longer convert dollars to gold at a fixed price, thus abandoning the Bretton Woods Agreement which had seen the US fix the price of gold around $35 per ounce for nearly three decades. Since its emancipation, the price of gold has appreciated over 5000% against the US Dollar at an annualised rate of 8.3% per year.
It hasn’t all been one way traffic, after an initial surge in the 1970s, the price of gold nearly halved over the course of the subsequent two decades in the 1980s and 1990s, before resuming its parabolic march from 2001 to 2011, reaching it’s previous all-time high of $1900 per ounce during the Eurozone Debt Crisis.
On the face of it gold is an attractive asset, it’s a precious and finite commodity with safe haven appeal in times of market stress and global uncertainty, and it maintains its store of value over very long periods of time. However, its weakness has remained its persistent inverse correlation to the strength of the world’s reserve currency, the US Dollar, and since 2011 it has spent most of the last decade in the doldrums as the US Dollar appreciated over this period.
More recently though, the US DXY Index, which measures the value of the US Dollar relative to a basket of six major foreign trading partner currencies (namely the Euro, Japanese Yen, British Pound, Canadian Dollar, Swedish Krona and Swiss Franc), has depreciated by over 9% since the height of the coronavirus crisis in late March this year. Could this be a turning point for the US Dollar and for gold’s fortunes? Indeed, the price of gold has rallied 34% over this period, and when viewed over the long-run the US Dollar is still not particularly cheap, nor expensive. Even after it’s decline this year the DXY Index is still 31%above its 2008 trough.
A weakening US Dollar would not be the only thing going for gold, its goldilocks environment this year also consists of low interest rates coupled with rising inflation expectations, and growing demand from exchange traded funds (ETFs) and central banks.
Central banks are now printing money again and expanding their balance sheets via quantitative easing programmes, which require greater gold holdings in order to maintain a desired level of balance sheet diversification. Let’s not forget that gold is also a Veblen good, one with rare and exclusive qualities that contradict the laws of economics by experiencing increasing demand with increasing prices. Of course, this is also the defining characteristic of a market bubble, and like all bubbles, one day they will pop.
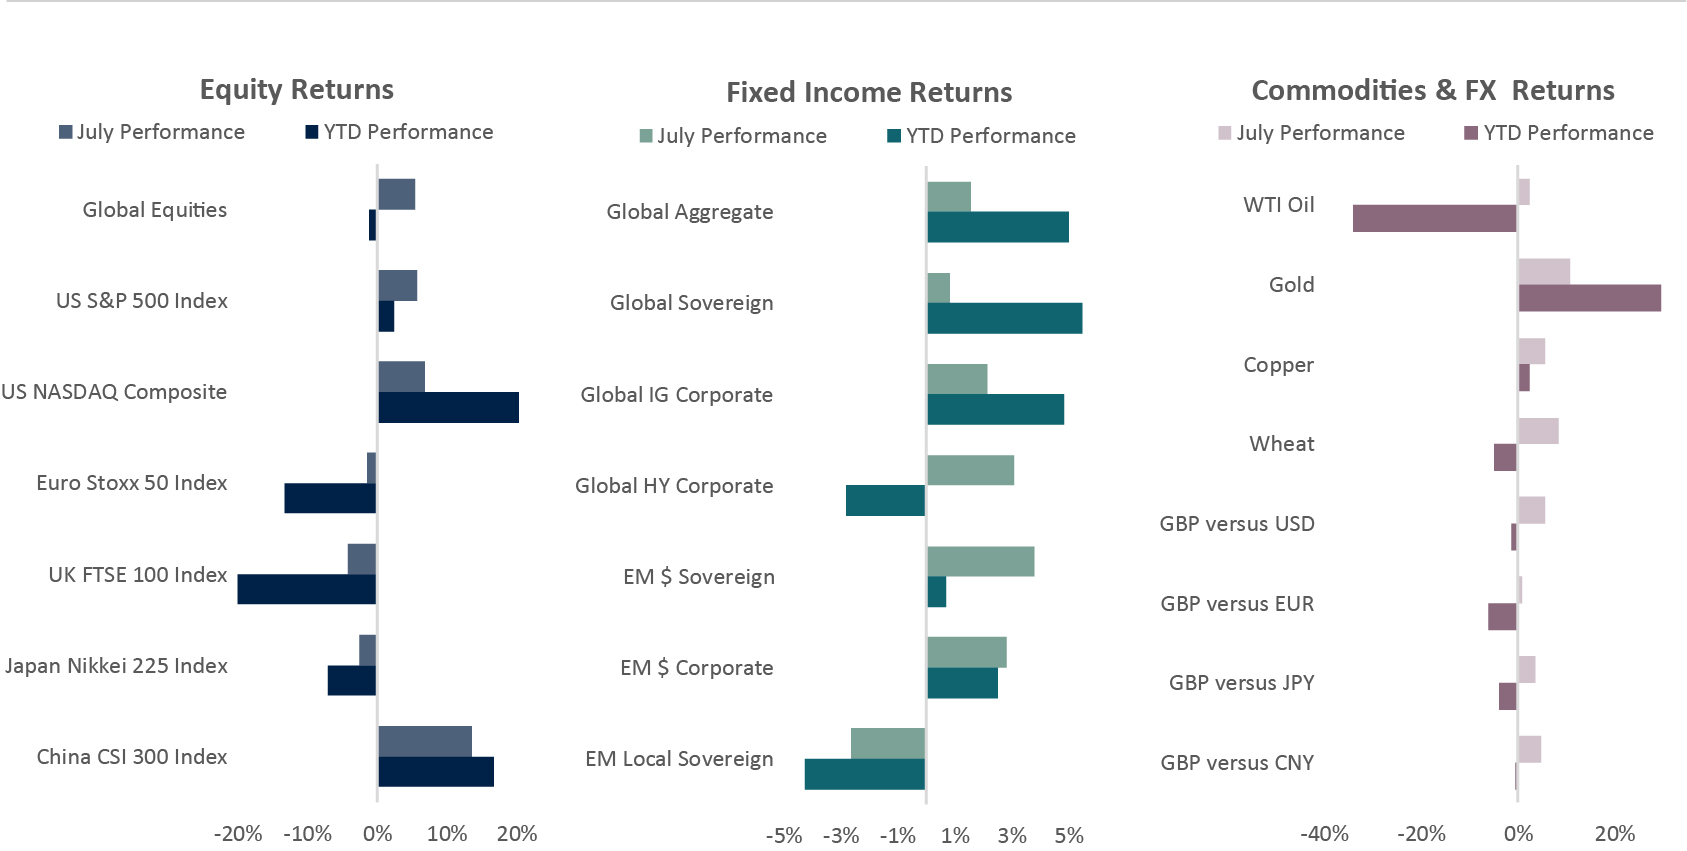
Source: Signia Wealth, Bloomberg. Data as at 31/07/2020. Global Equities: iShares MSCI ACWI ETF; Global Aggregate: Vanguard Global Bond Index GBP Hedged Fund; Global Sovereign: Xtrackers Global Government Bond GBP Hedged ETF; Global IG Corporate: Vanguard Global Corporate Bond Index GBP Hedged Fund; Global HY Corporate: iShares Global High Yield Corporate Bond GBP Hedged ETF; EM$ Sovereign: iShares J.P. Morgan USD EM Bond ETF; EM$ Corporate: iShares J.P. Morgan USD EM Corporate Bond ETF; EM Local Sovereign: iShares J.P. Morgan EM Local Government Bond ETF.
Equities
• Domestic Chinese equities outperformed during July, as increased participation by retail investors drove the market higher.
• US equities also recorded strong returns, with robust corporate earnings from mega-cap technology names spurring sentiment.
• European, UK, and Japanese bourses ended the month in negative territory, with their greater cyclical composition weighing on returns.

Jack Rawcliffe
Fixed Income
• Global bonds had a strong month with most sub sectors rallying as bond yields continued their decline.
• Global sovereign and safe heaven bonds remained in demand from central bank purchase programmes and as covid-19 infections continued to rise across the world, with the US and Latin America the worst affected hit regions.
• Global corporate and dollar denominated emerging market bonds outperformed, as the global economic recovery continued despite some of these covid-19 trends.
• Local currency emerging market debt measured against Sterling underperformed as the British Pound rallied strongly against most worldwide currencies

Grégoire Sharma
Commodities & FX
• Gold surged 11% in July as a result of the decline in the US Dollar, low interest rate environment, and creeping inflation expectations. The precious metal is up over 30% for 2020, and has witnessed over $53bn of inflows into gold portfolios and $43bn into ETF’s.
• Wall Street’s fear gauge, “The VIX Index”, declined nearly 20% in July, as a result of the on-going support from Governments and Central Banks, and improving economic data, brushing off concerns of a continued rise in the daily global infection caseload of Covid-19

Harry Elliman
Choose a Service to Invest through
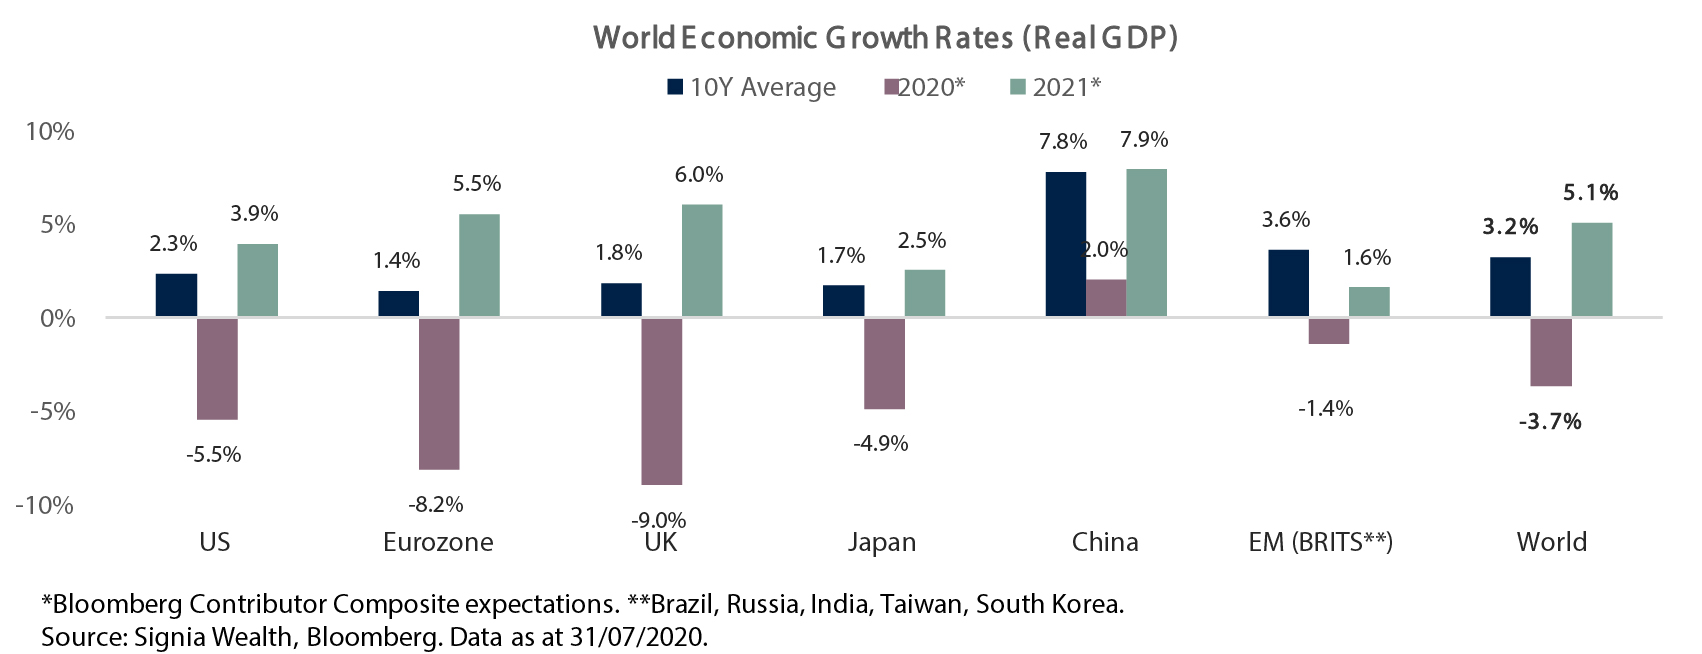
World
Expectations for World growth in 2020 have been revised down considerably in the wake of the Coronavirus crisis, from+3.1% at the end of 2019 to -3.7% in July. Asian economies are expected to outperform with China, Taiwan and India the only major economies expected to grow this year. Currently, world growth is expected to rebound strongly in 2021, although this remains largely contingent on the rollout and effectiveness of a successful Covid-19 vaccine and the persistence of global infections.
United States of America
The economy is rebounding quicker than expected after the shortest sharpest economic recession in history, which has seen the US economy contract -10.8% in nominal terms during the first half of 2020. Most states relaxed their lockdown rules and reopened for business in May, but with signs of rising infections across southern ‘sunbelt states’ in June and July, the economic recovery will likely slow in the second half of the year as lockdown restrictions are reintroduced.
Eurozone
Europe entered 2020 on a relatively weaker economic footing and has a weaker structural growth rate and so it’s no surprise that it is expected to experience a deeper recession this year versus other regional economies. Deflation risk is a real concern but with the European Recovery Plan now agreed amongst member states, expectations for higher economic growth in 2021 and beyond are rising.
United Kingdom
The UK has followed a similar economic fate to the Eurozone but after being slower to introduce coronavirus containment measures the UK has suffered the most Covid-19 deaths in Europe and the third most worldwide behind the US and Brazil. A strong fiscal response from Chancellor Rishi Sunak has improved the economic outlook for 2021.
Japan
The Japanese economy is geared towards global trade activity and has suffered disproportionally more than its regional neighbours this year as global trade seized up, However it is expected to stage a resilient domestic recovery following some of the most significant fiscal and monetary stimulus packages announced by policymakers to support growth.
China
China is one of very few major economies that has avoided a recession this year by growing an impressive 11.5% in the second quarter after returning economic operating capacity quickly back towards 2019 levels. Chinese GDP is expected to rebound to its long-term historical growth rate of near 8% in 2021.
Emerging Markets
Emerging economies outside of Asia have been amongst the last to feel the full economic and humanitarian impact from the coronavirus crisis. Performance is expected to be mixed this year with commodity producers Brazil and Russia suffering from a collapse in prices, India as a net importer of commodities benefitting from price declines; and Taiwan and South Korea feeling less economic pain domestically due to successful virus testing and containment measures.
Important Information
The information set out in this document has been provided for information purposes only and should not be construed as any type of solicitation, offer, or recommendation to acquire or dispose of any investment, engage in any transaction or make use of the services of Signia. Information about prior performance, while a useful tool in evaluating Signia’s investment activities is not indicative of future results and there can be no assurance that Signia will generate results comparable to those previously achieved. Any targeted returns set out in this document are provided as an indicator as to how your investments will be managed by Signia and are not intended to be viewed as a representation of likely performance returns. There can be no assurance that targeted returns will be realised. An estimate of the potential return from an investment is not a guarantee as to the quality of the investment or a representation as to the adequacy of the methodology for estimating returns. The information and opinions enclosed are subject to change without notice and should not be construed as research. No responsibility is accepted to any person for the consequences of any person placing reliance on the content of this document for any purpose. No action has been taken to permit the distribution of this document in any jurisdiction where any such action is required. Such distribution may be restricted in certain jurisdictions and, accordingly, this document does not constitute, and may not be used for the purposes of, an offer or solicitation to any person in any jurisdiction were such offer or solicitation is unlawful. Signia Wealth is authorised and regulated by the Financial Conduct Authority.